The infographics were created as part of the "Visual Storytelling" course with David von Bassewitz at the Münster School of Design and were later modified for the "Lerchenfenster" project.

When collecting data, I used reliable sources, which were organized using Miro Board.
Part of project's Miro Board
Handstorming was in this case the most effective technique for getting ideas for graphical interpretation and layout of data:

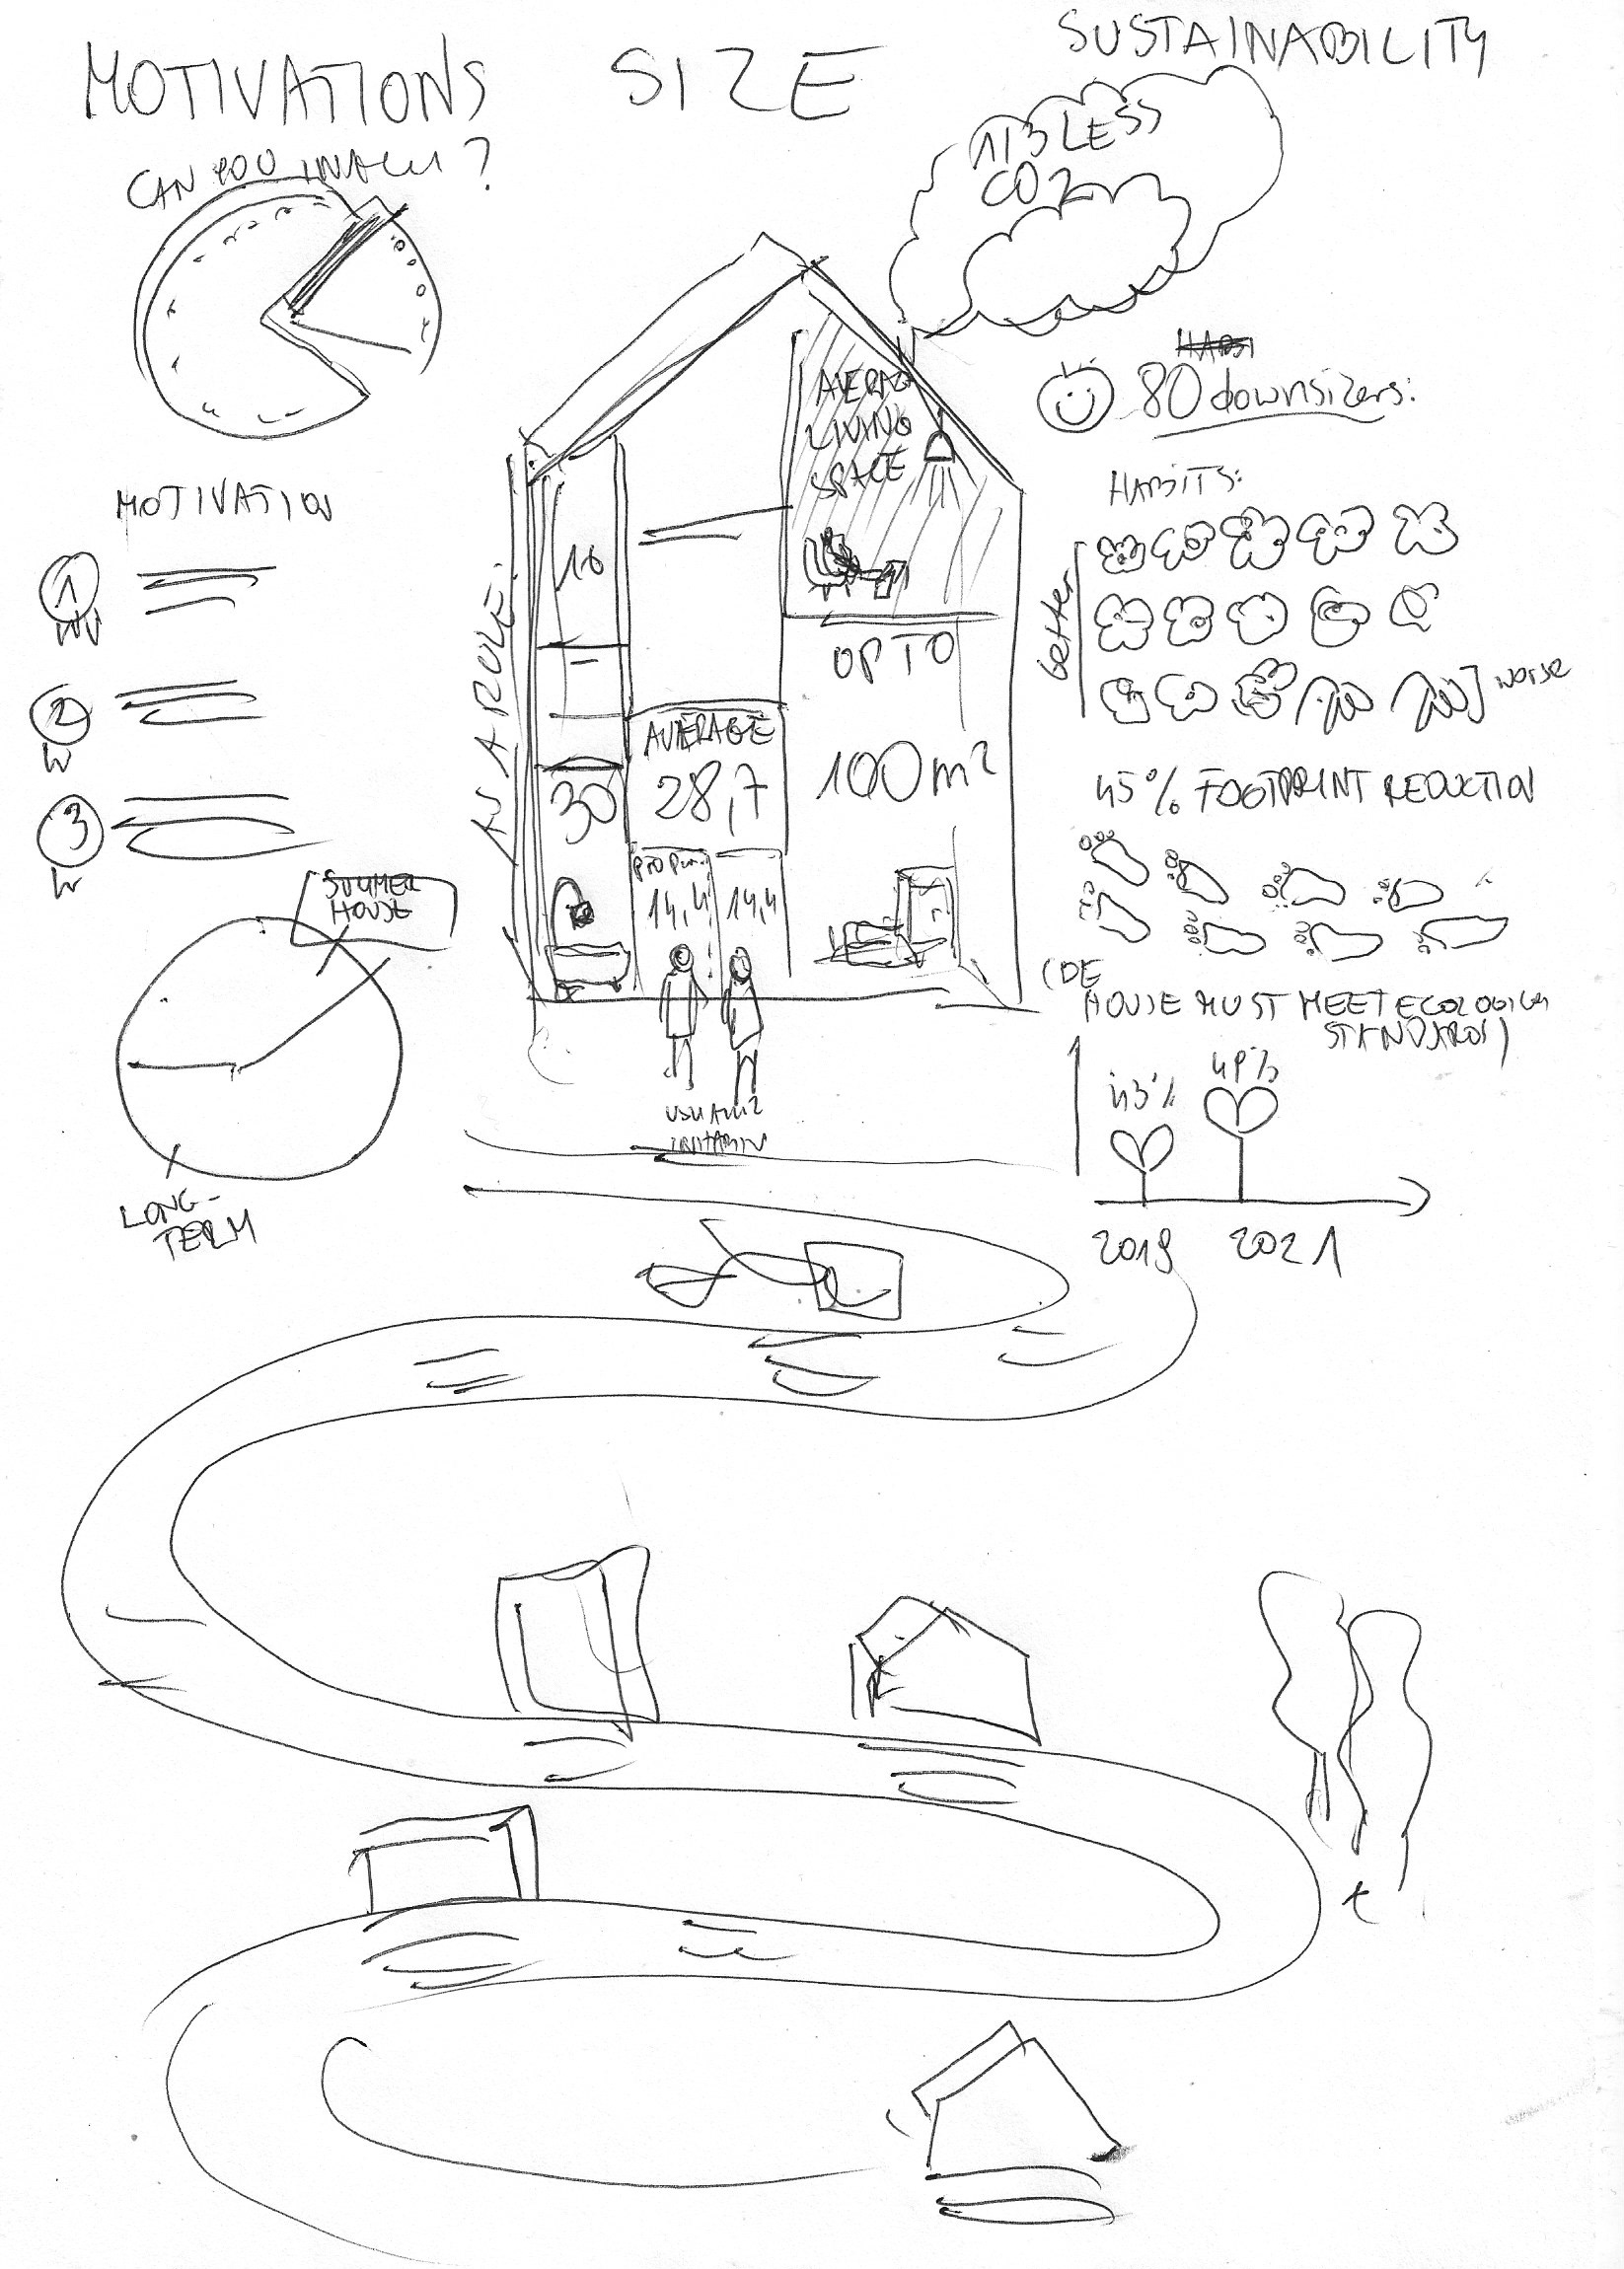
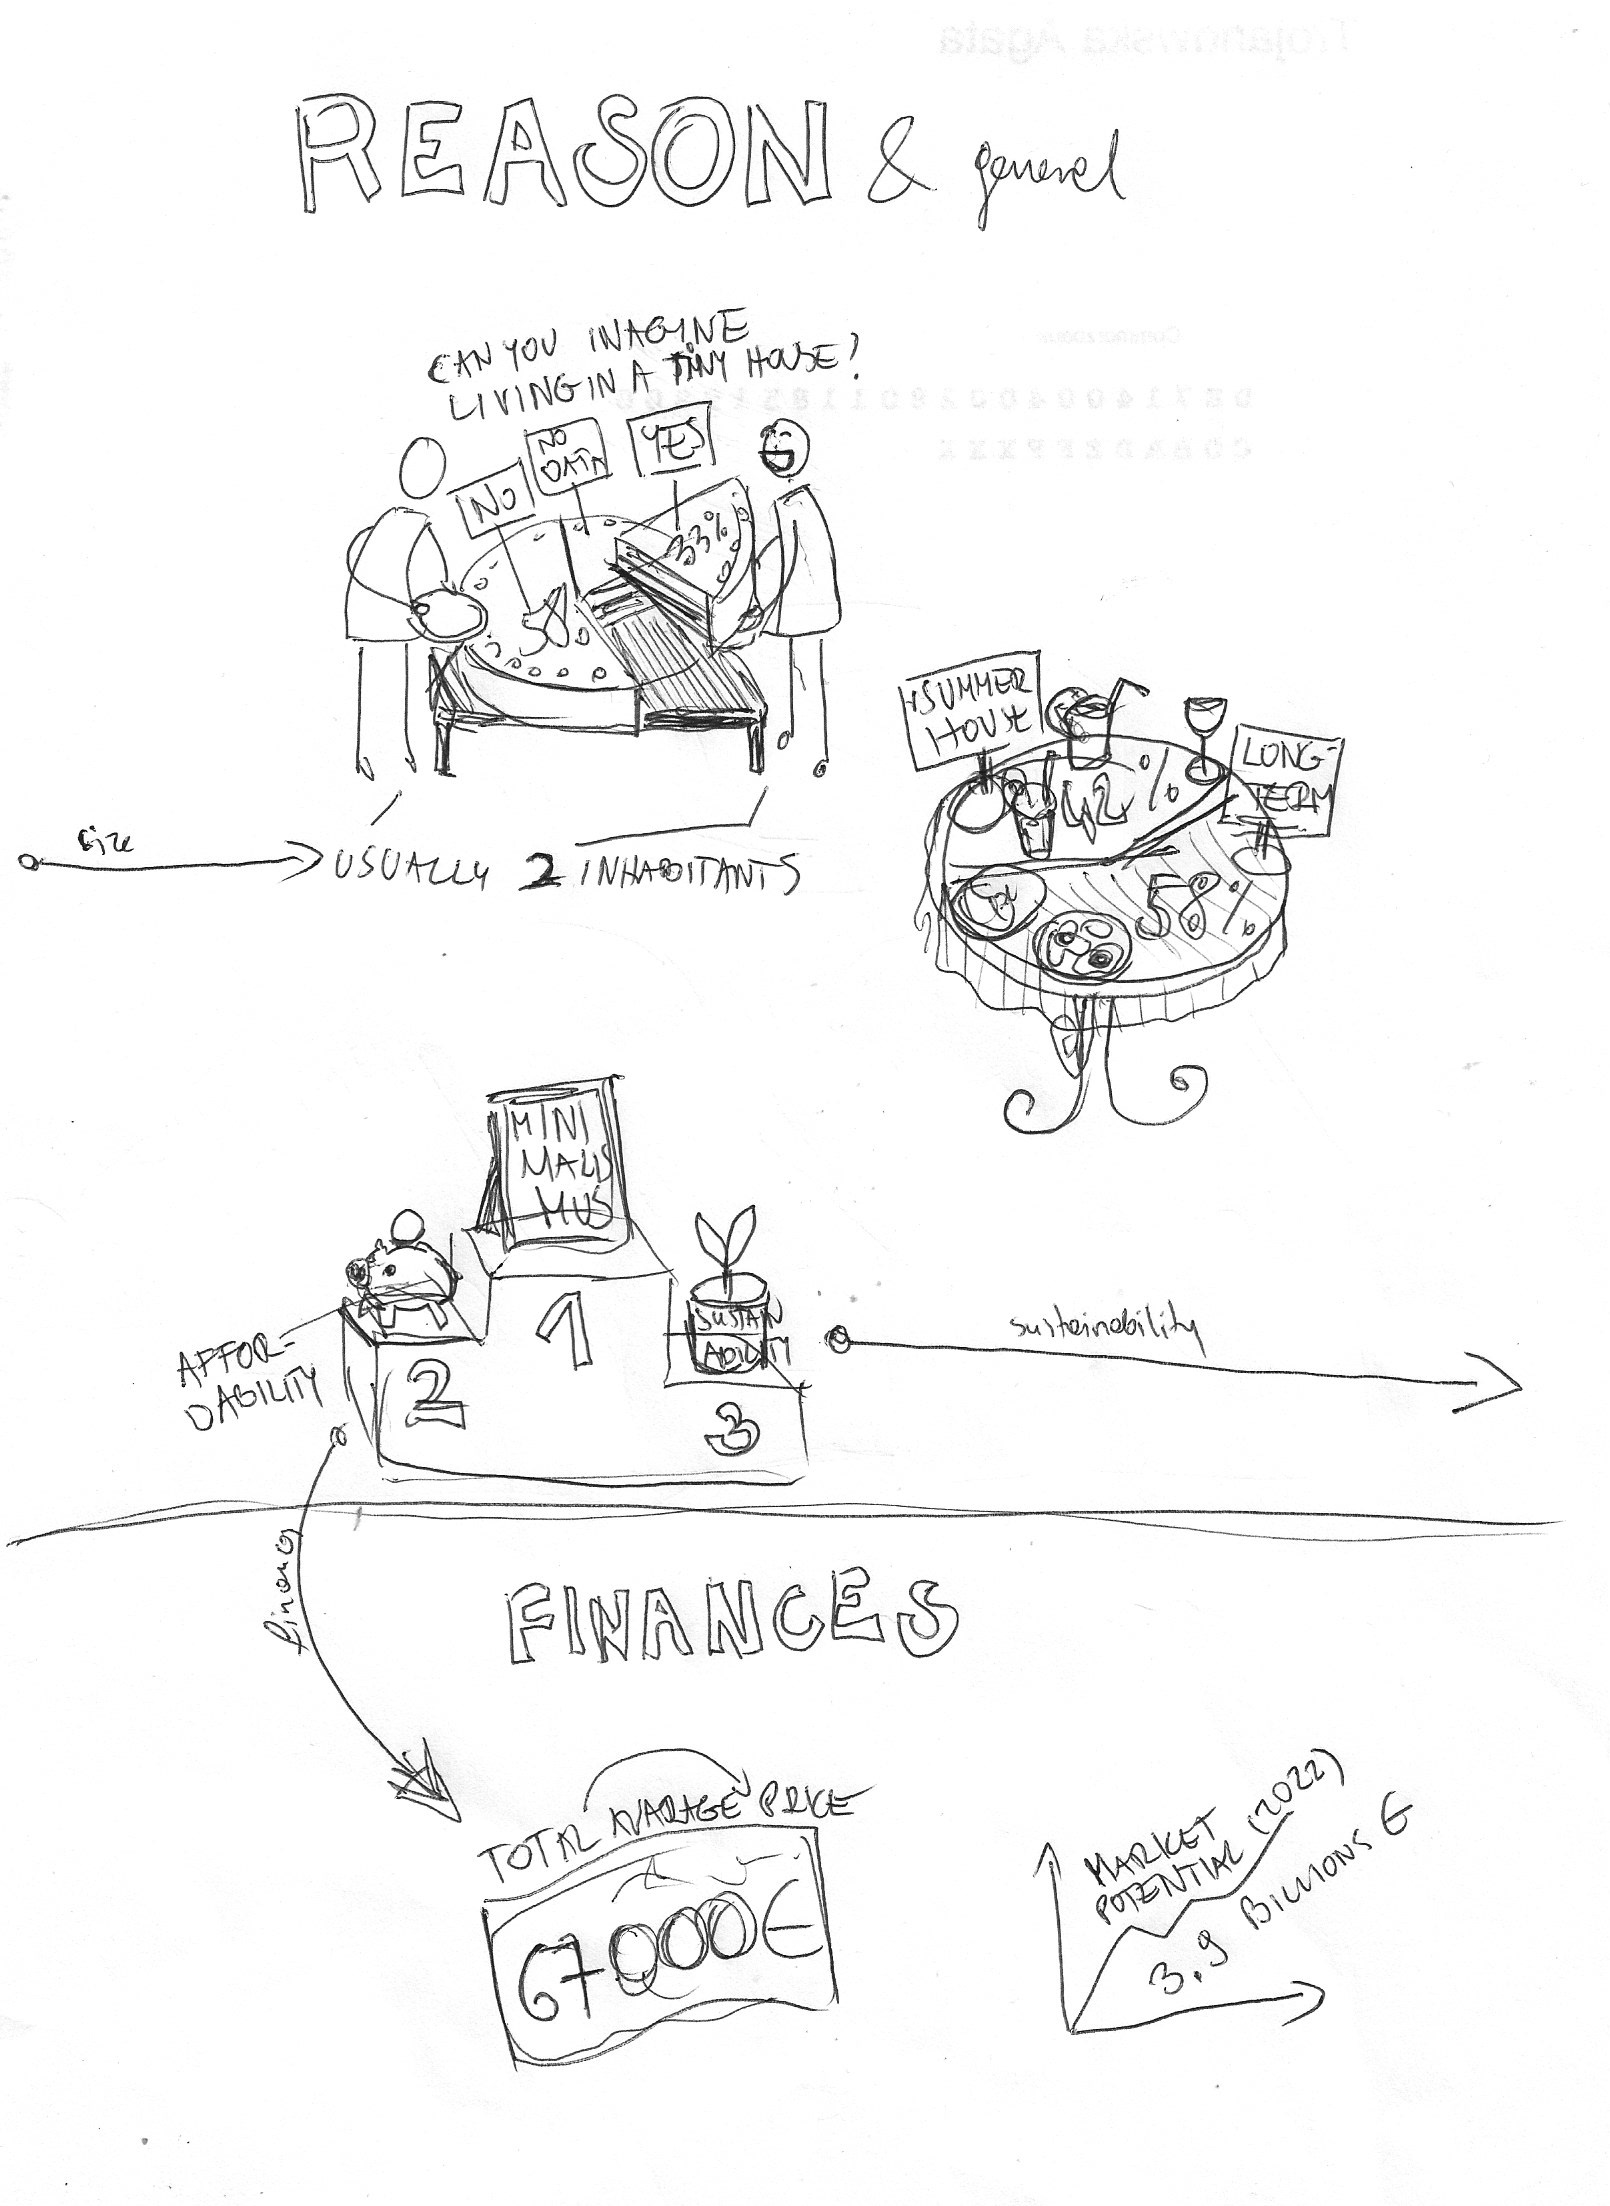
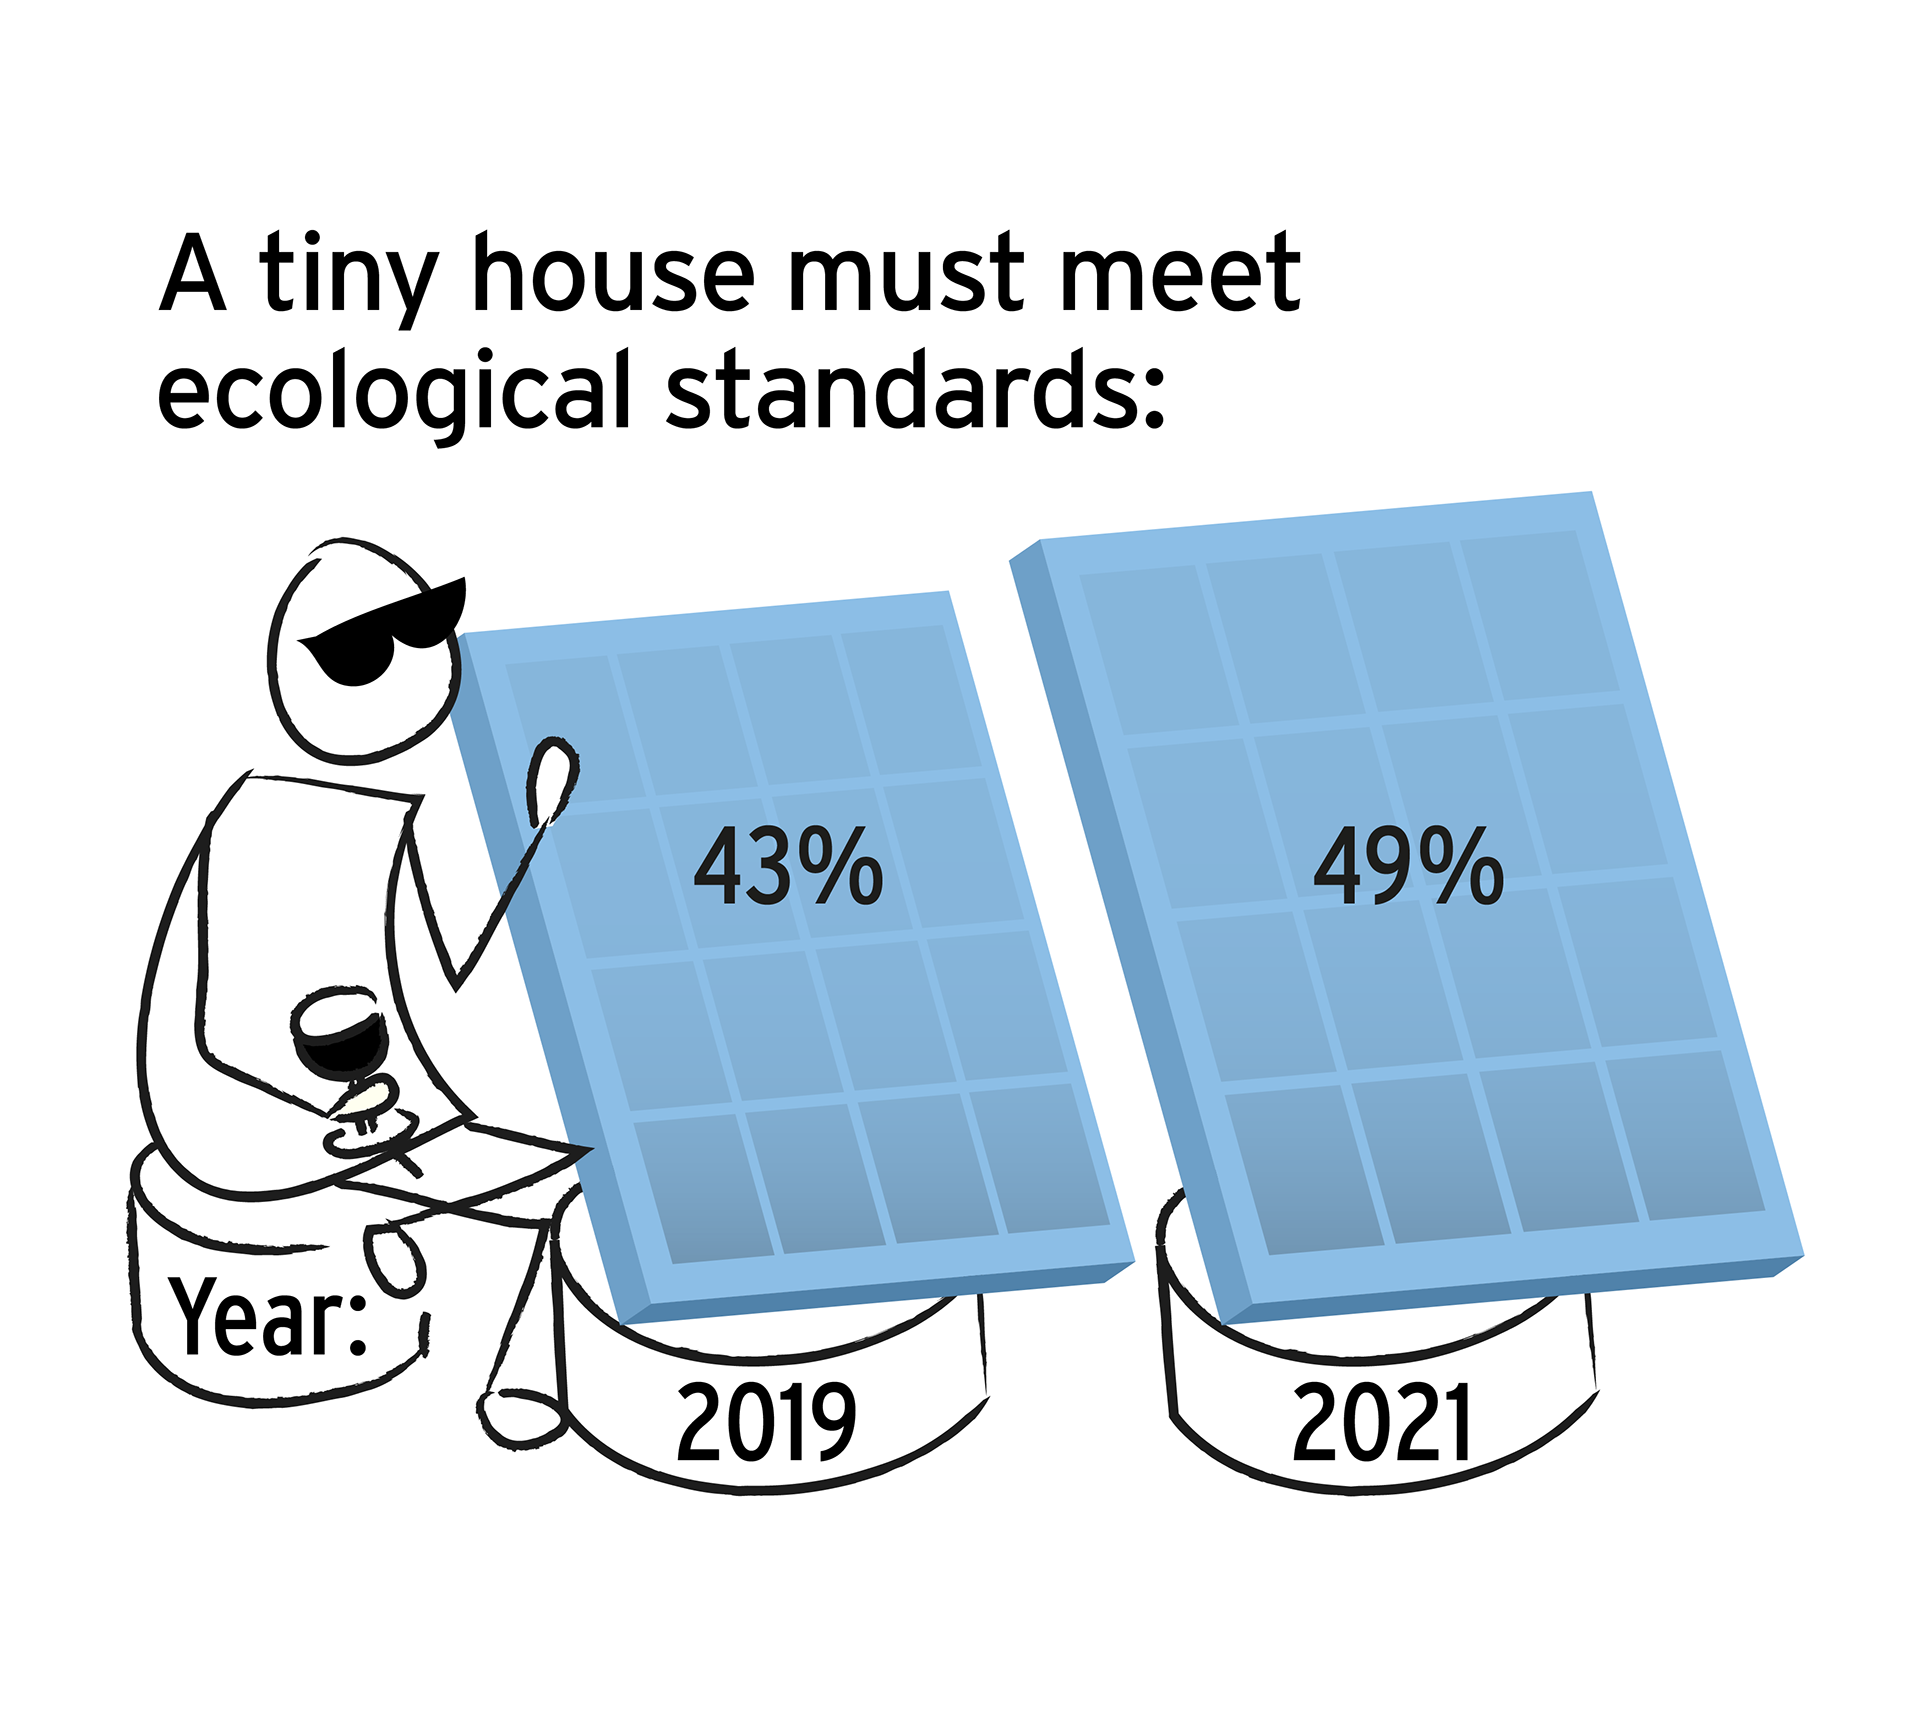
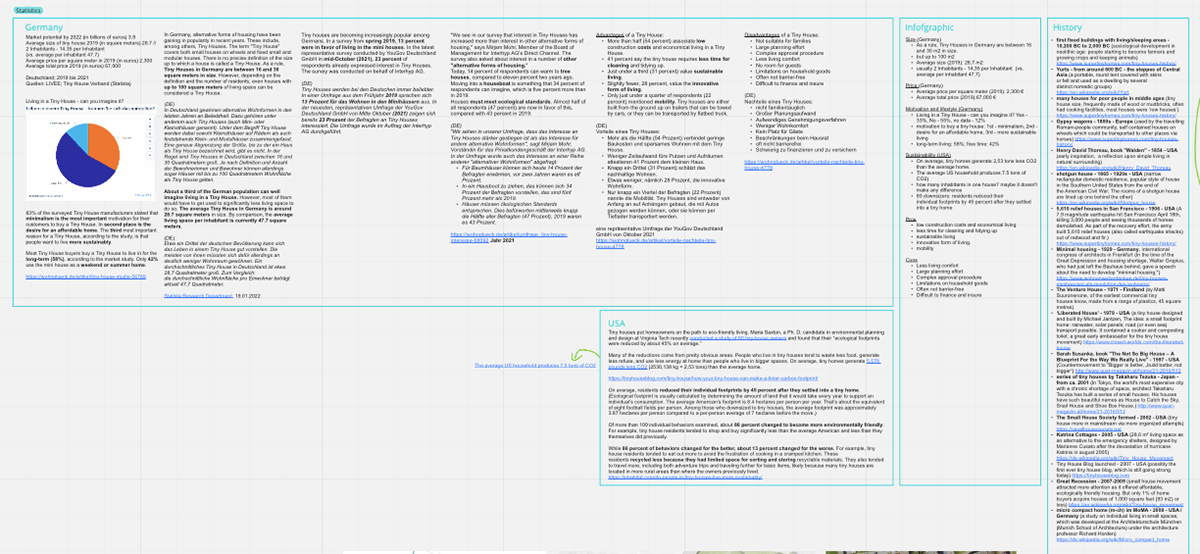
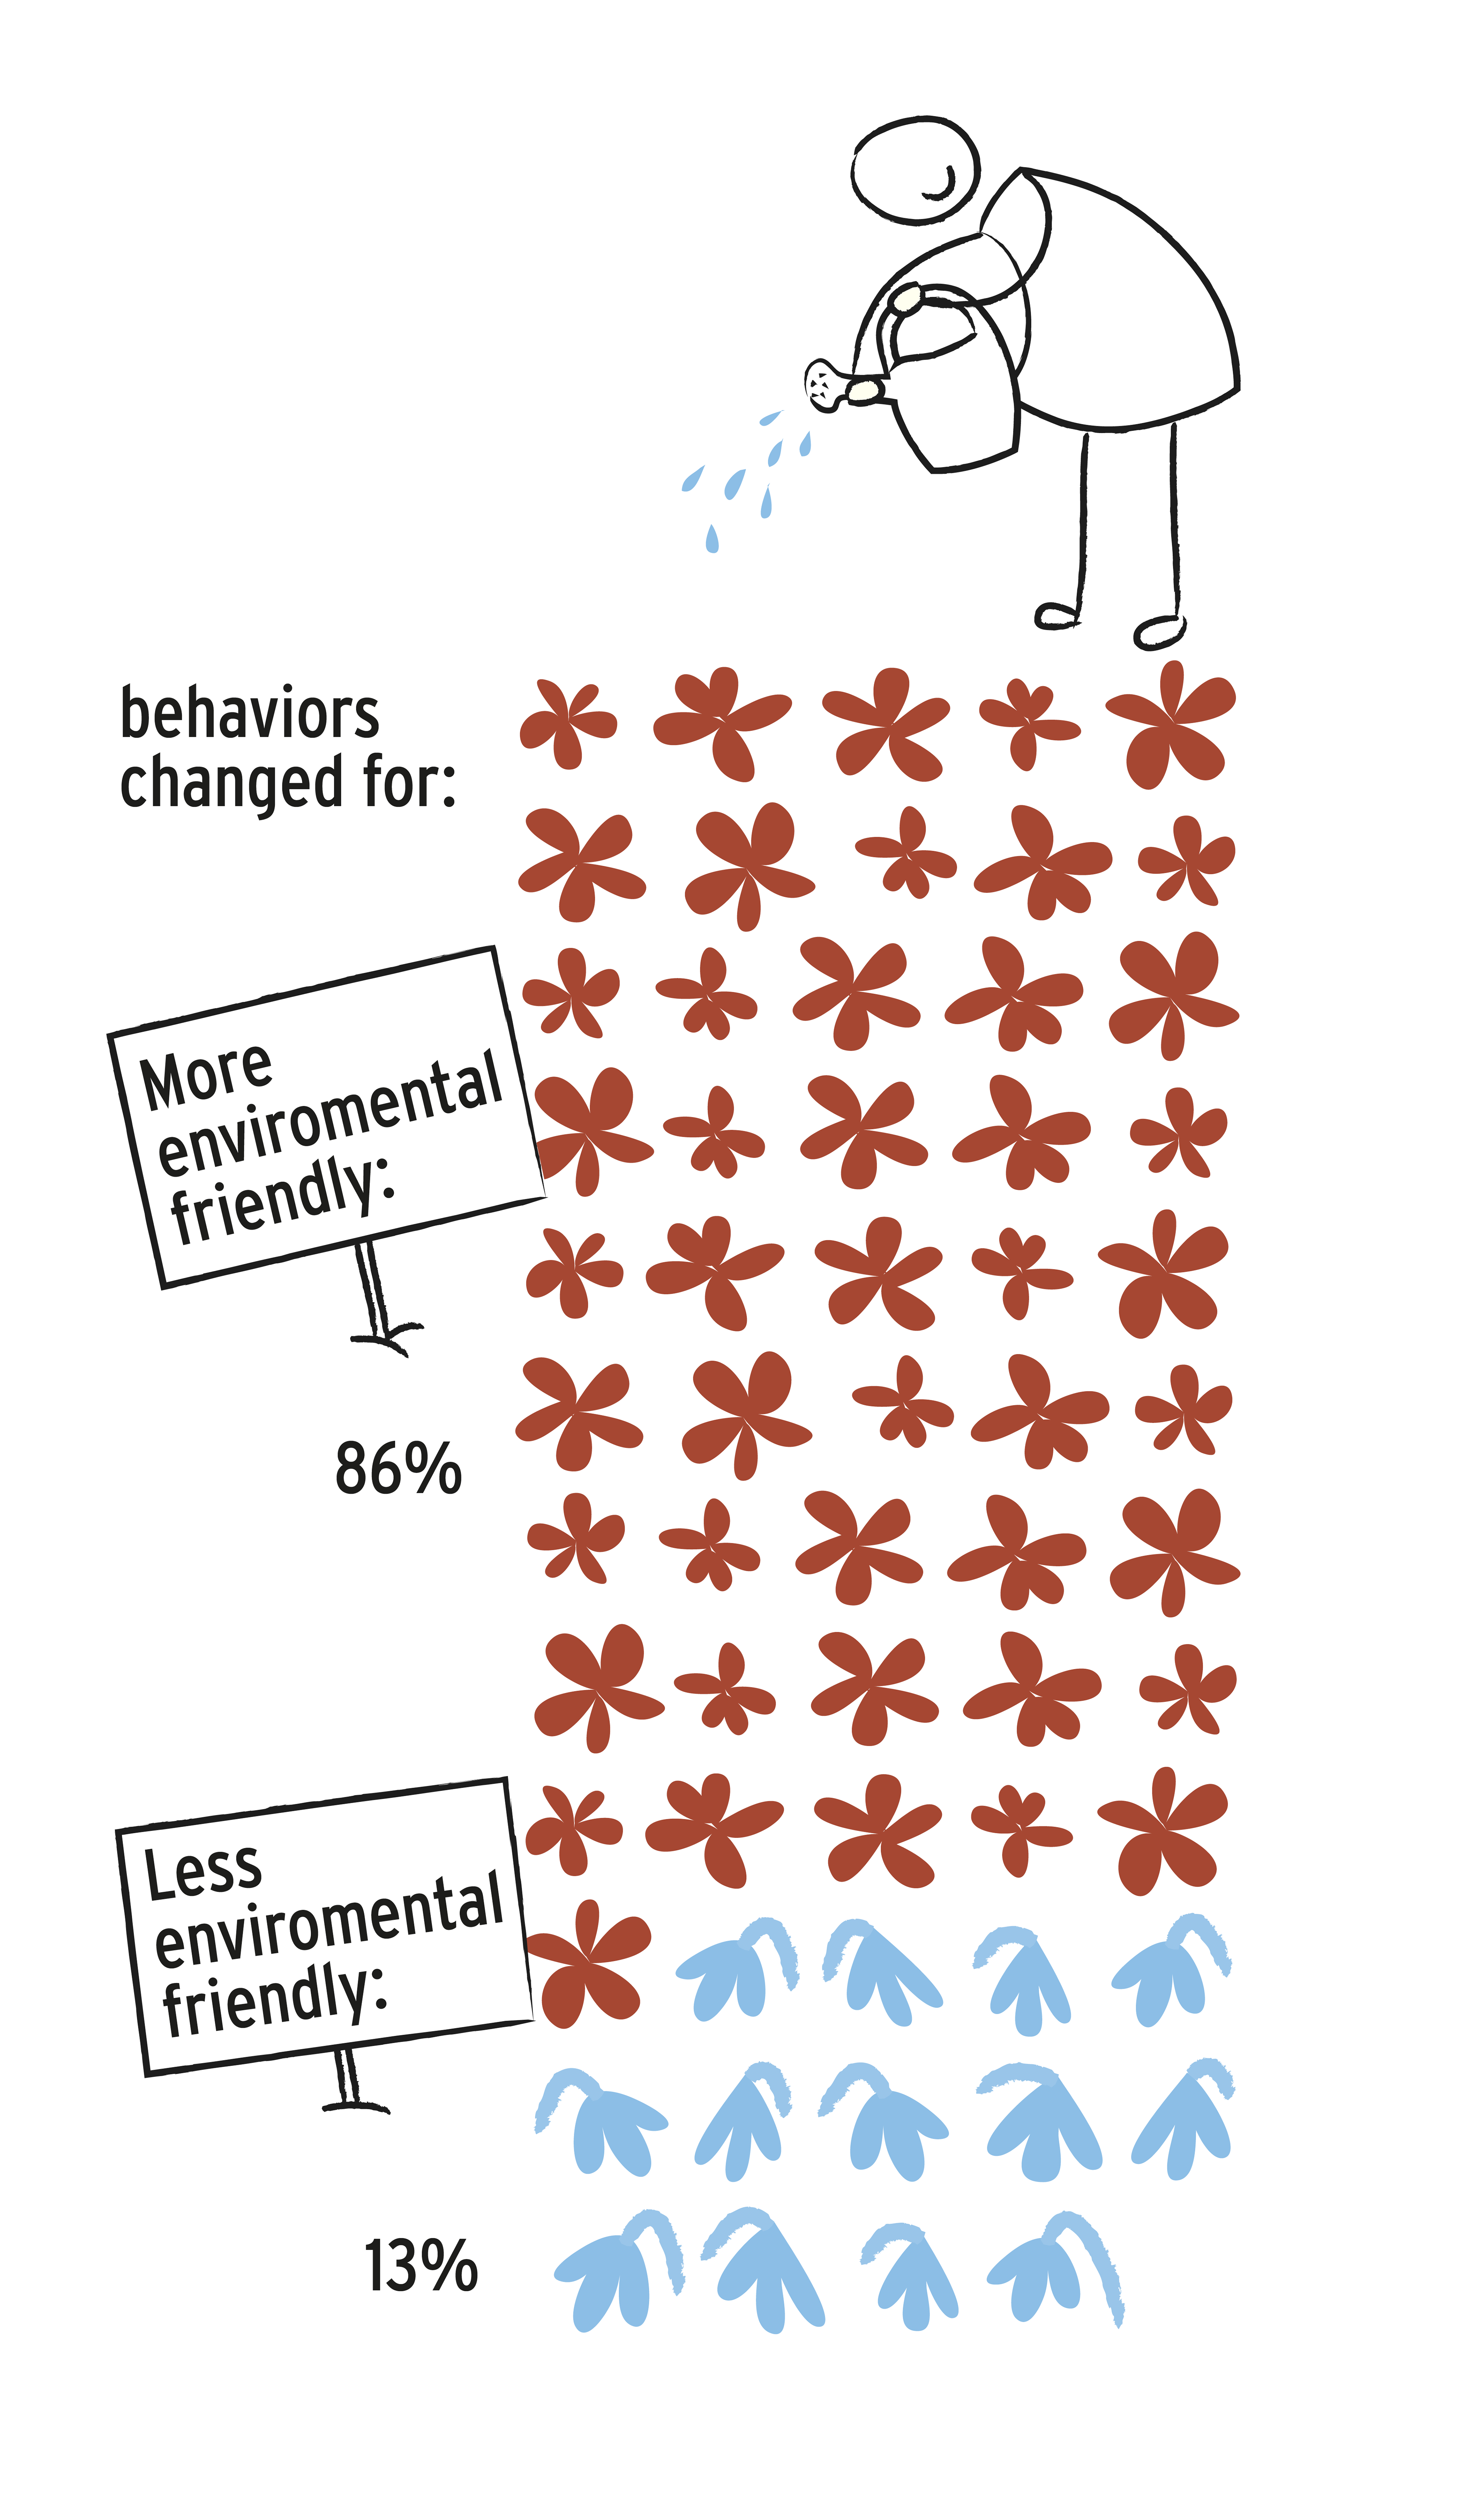
I filled in the missing statistics regarding the environmental performance of tiny houses in Germany with data from the US:
To keep the design consistent, I selected the colors and typeface based on the visual identity system of the mentioned "Lerchenfenster" project.